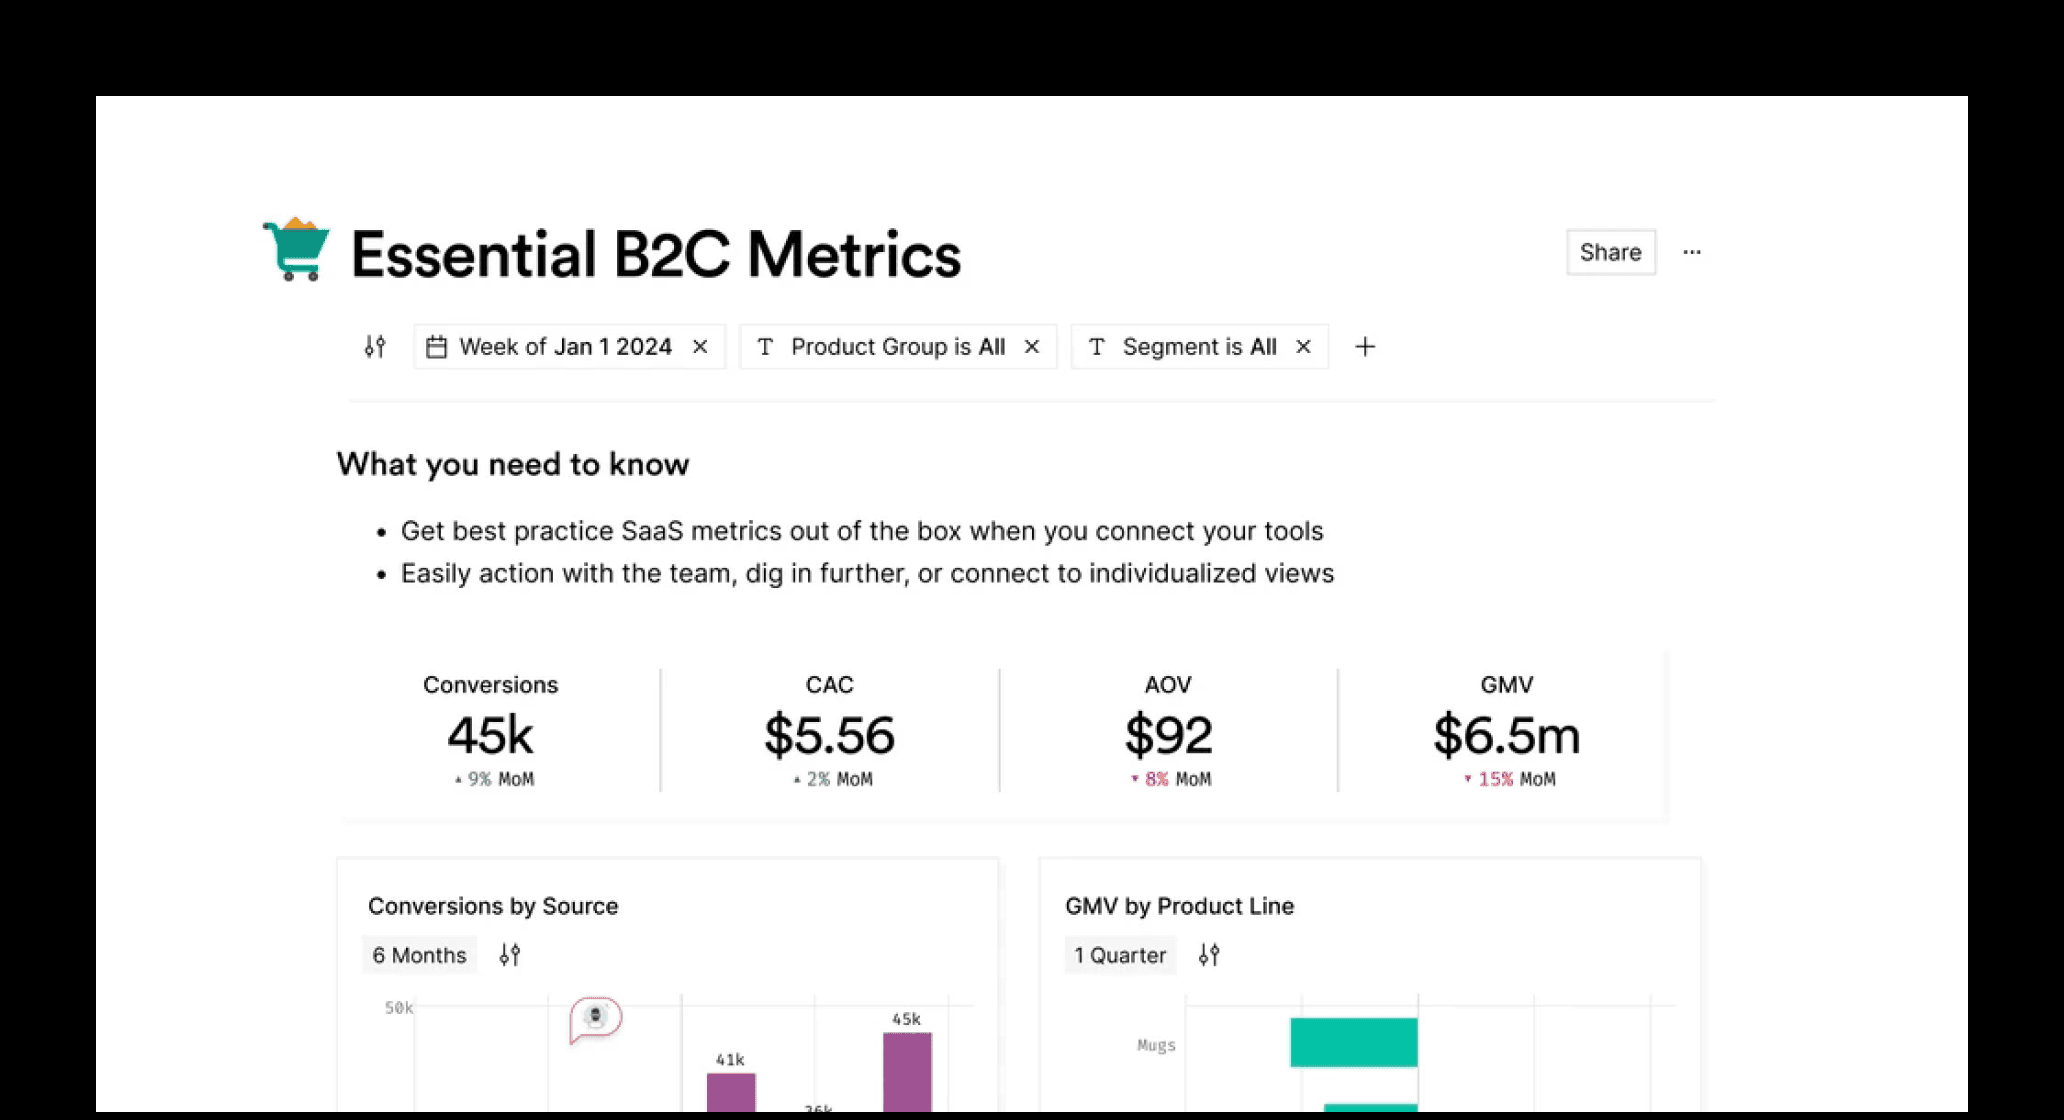
Track your store’s performance. Take your business to the next level.
Monitor your store’s sales and product performance with our Shopify Sales Dashboard for Google Sheets. Visualize your core Shopify metrics automatically, and build your own customizations on top of our free template.
View revenue and order count by month, product, and country
Easily adjust dashboards by adding custom fields
Filter dashboards for specific time periods, geographic locations, and more
Import other data sources or Shopify reports to enhance your analysis
What Are the Different Types of Sales Reports in Shopify?
Finances Report: Provides an overview of your sales, payments, pending payments, and account information such as your Shopify fees. You can view different finance reports based on your channels within your Shopify account, including your online shop, any physical stores that you use Shopify Point of Sale software for, and apps, or Facebook or Pinterest sales that are linked.
Sales Reports: Details all the information related to the orders that have been placed. You can view your sales by month, hour, channel, location (for Point of Sales), staff, and by product. You can find some key metrics like average order value, gross sales, and net sales in this report. And you can view the ‘Sales by traffic referrer’ report, which breaks down where your customers come from.
Share this template
Other Metrics
View All Metrics
Connect your live data to Templates to inspire and help you get started quickly.
Sources
View All Sources
Connect your live data to Templates to inspire and help you get started quickly.


